YOUR NEXT DISCOVERY/SpaceFollow your curiosity
Jezero Crater Elevation Graph
NASA / JPL · Reuse terms

Space / 2024-12-12

Jezero Crater Elevation Graph

Jezero Crater Elevation Graph

NASA's image library records Jezero Crater Elevation Graph.

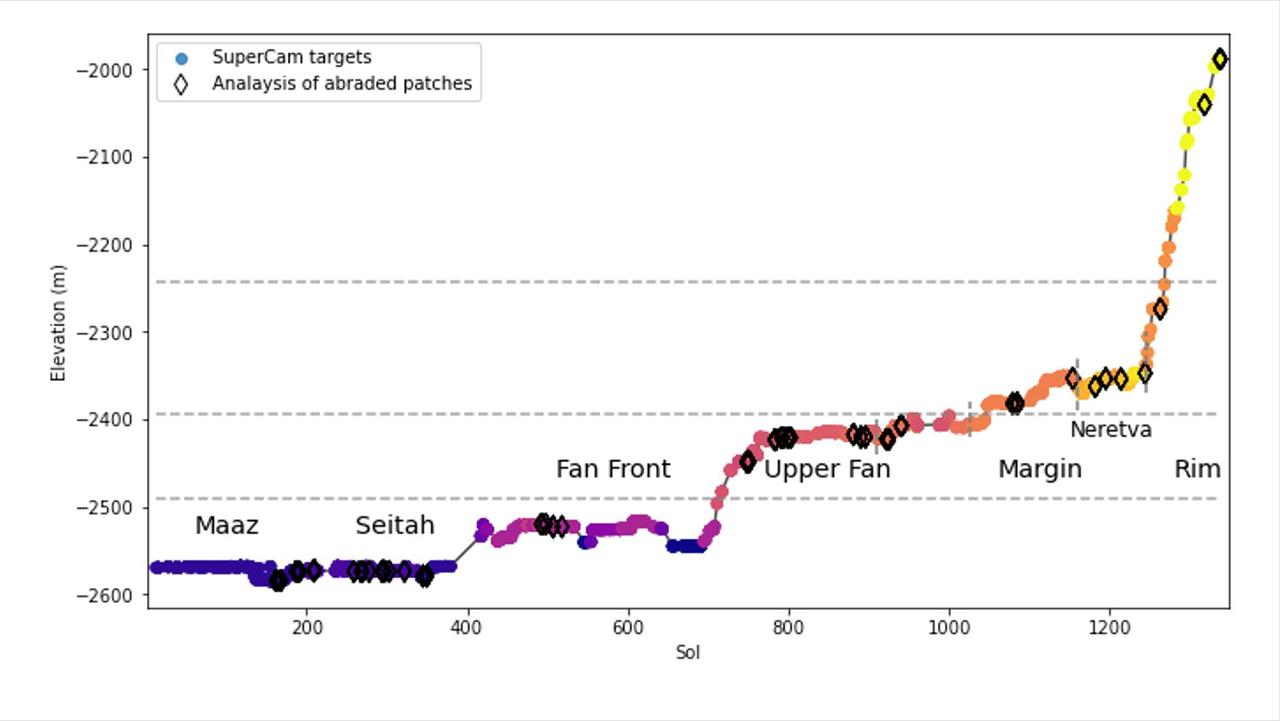
This graph shows the relative elevation of various sampling sites visited by NASA's Perseverance Mars rover. Colored dots along the line represent targets where data was collected by the rover's SuperCam laser instrument; the colors correspond to different regions within Jezero Crater, which are labeled. The black diamonds represent locations where

SERENDIPITYA little unexpected
FamiliarWeird

This graph shows the relative elevation of various sampling sites visited by NASA's Perseverance Mars rover. Colored dots along the line represent targets where data was collected by the rover's SuperCam laser instrument; the colors correspond to different regions within Jezero Crater, which are labeled. The black diamonds represent locations where the rover's abrasion tool was used to collect data on rock composition. The x-axis indicates the sol, or day, of the rover's mission, and the y-axis shows elevation in meters. Jezero Crater sits about 8,530 feet (2,600 meters) below reference level (the equivalent for "sea level" on Mars, which does not have any oceans), which is why the numbers appear to be decreasing as Perseverance is gaining elevation. The dotted horizontal lines represent e

Explore NASA's original image record for credits and available downloads.

NASA Image and Video LibraryJezero Crater Elevation Graph

Original explanation based on the sources above. Images carry their own reuse terms.