YOUR NEXT DISCOVERY/SpaceFollow your curiosity
NIMS Spectral Maps of Jupiter Great Red Spot
NASA / JPL · Reuse terms

Space / 1998-03-26

NIMS Spectral Maps of Jupiter Great Red Spot

NIMS Spectral Maps of Jupiter Great Red Spot

NASA's image library records NIMS Spectral Maps of Jupiter Great Red Spot.

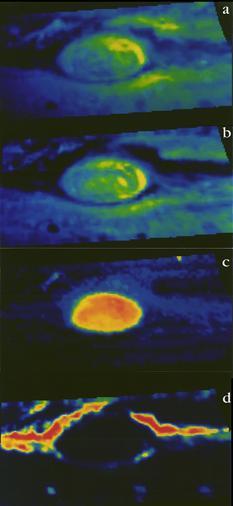
The Near-Infrared Mapping Spectrometer (NIMS) instrument looks at Jupiter's Great Red Spot, in these views from June 26, 1996. NIMS studies infrared wavelengths of light that our eye cannot see. These maps are at four different infrared wavelengths, each one picked to reveal something different about the atmosphere. The top image is a false color m

SERENDIPITYA little unexpected
FamiliarWeird

The Near-Infrared Mapping Spectrometer (NIMS) instrument looks at Jupiter's Great Red Spot, in these views from June 26, 1996. NIMS studies infrared wavelengths of light that our eye cannot see. These maps are at four different infrared wavelengths, each one picked to reveal something different about the atmosphere. The top image is a false color map of a wavelength that is at the red edge of our ability to see. It shows the shapes of features that we would see with our eyes. The second map is of ammonia ice, red showing where the most ice is, blue where none exists. The differences between this and the first image are due to the amount and size of ammonia ice crystals. The third map down is from a wavelength that shows cloud heights, with the highest clouds in red, and the lowest in blue.

Explore NASA's original image record for credits and available downloads.

NASA Image and Video LibraryNIMS Spectral Maps of Jupiter Great Red Spot

Original explanation based on the sources above. Images carry their own reuse terms.